Review of geothermal conditions of Hungary
Abstract
The heat flow map of Hungary was presented in the Atlas of Geothermal Resources in Europe in 2002 and was last updated in 2005. Since that time several geothermal projects, e.g. TransEnergy (2010-13), assessment of the geothermal potential of the Drava basin (2013) Paks-II, NPP (2016) and continuous drilling activity in the country have been in progress. Large amount of temperature data became available, which allowed the update of the Geothermal Database of Hungary and the compilation of an updated heat flow map and temperature maps.
The heat flow is determined based on the Fourier law using the thermal conductivities of rocks and temperature gradient calculated from temperature observations in boreholes and wells. The thermal conductivity is known from laboratory measurements made on core samples. The thermal conductivities and the temperature data are stored in the Geothermal Database of Hungary.
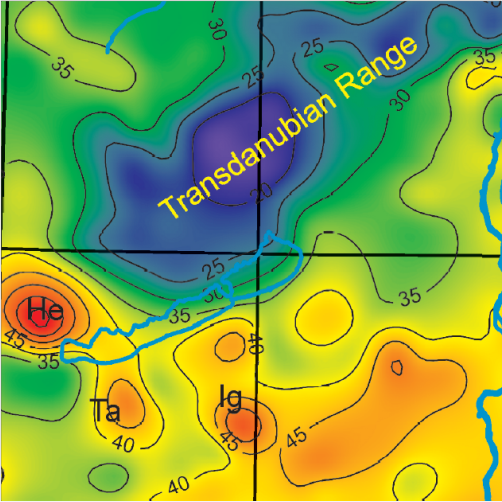
The heat flow is calculated in 2001 boreholes and wells using the Bullard-plot technique. The mean heat flow in Hungary is 90 mW/m2, varying between 30 mW/m2 and 120 mW/m2. The high values are found over buried basement highs in the eastern and southern part of the country, while the low values are located in the recharge areas of karstic flow systems. In the sedimentary basins, where the thickness of the Neogene and Quaternary sediments reaches 5-7 km, the heat flow is slightly below the mean value (80-90 mW/m2) due to the cooling effect of sedimentation. These basins contain the main thermal water aquifer in Hungary utilized for district heating and green house heating. The buried basement highs characterized by high heat flow (100-120 mW/m2) are potential sites to create artificial geothermal reservoirs by hydraulic fracturing (EGS).
Temperature maps at 500 m, 1 km, 2 km and 3 km depths were also compiled. Similarly to the heat flow, the temperature anomalies strongly reflect the local and regional groundwater flow systems.